
A full-stack exploration of accident risk prediction and interactive geospatial modeling.
When the Kaggle Playground Series S5E10 launched a challenge to predict road accident risk, I decided to take it further than a static notebook. The competition’s companion Stack Overflow Challenge invited developers to build an interactive application powered by their Kaggle models. The result of that experiment (and several weeks of iteration) is now live at road-risk-playground.tarterware.com .
I wrote and earlier blog post about one of the challenges of putting this together: Calculating Road Curviness: A Practical Approach with Mapbox and Python.
Concept
The goal was simple: let a user draw or select a driving route and instantly see the model’s estimated accident risk.
The implementation was not simple. It required blending machine learning, geospatial data, and cloud infrastructure in a way that felt fluid, fast, and realistic.
Architecture Overview
The finished system consists of three coordinated layers:
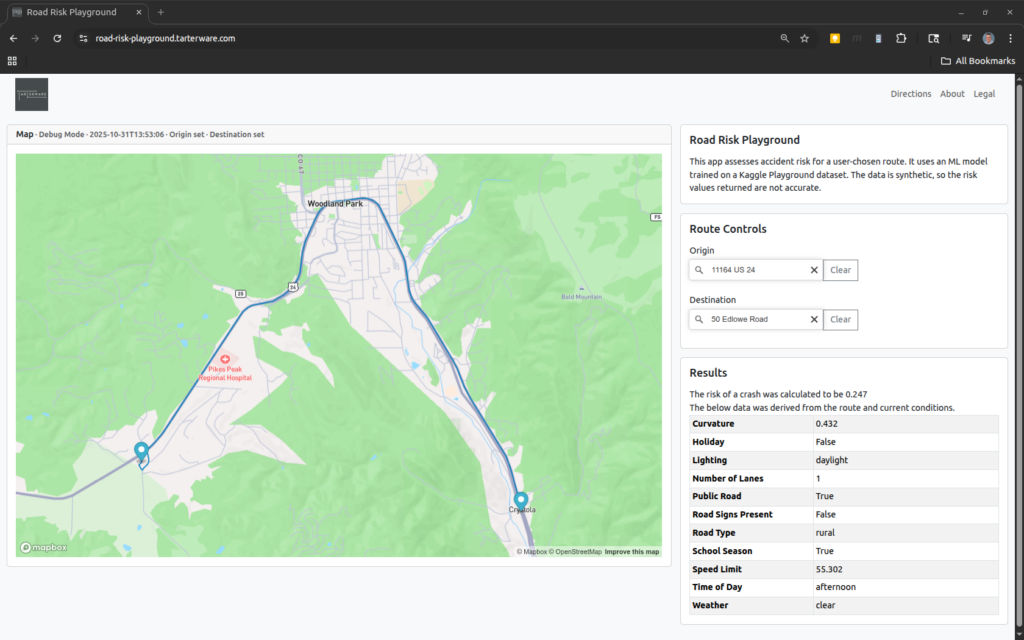
Front End (React + TypeScript + Mapbox GL)
The browser interface allows users to choose start and end points on a map or type street addresses. The application sends the route, date, and time to the backend, which returns both the predicted risk and all input variables used in the calculation. A results panel displays the score along with factors such as road curvature, lighting, and weather.Back End (AWS Lambda in Python)
The backend service runs as a Docker-packaged Lambda function. It calls the Mapbox Directions API to get detailed road geometry, classifies each segment (street, primary, highway), computes curvature, and determines daylight conditions using the route’s location and time.
It then queries the National Weather Service for local weather and passes all variables to the trained model. The model outputs a normalized accident-risk value between 0 and 1, which is returned to the web client.Infrastructure (Terraform on AWS)
Everything—S3 static hosting, CloudFront CDN, Route 53 DNS, ACM certificates, the Lambda function, and API Gateway—is defined in Terraform.
A Makefile automates the front-end build, S3 sync, and CloudFront invalidation. The Lambda image is built locally and pushed to Amazon ECR before deployment.
Development Timeline
The project evolved rapidly through daily commits in October 2025:
Model Research and Training (Oct 1-20): ML model development and training in local Jupyter notebooks and on Kaggle.
Backend Prototype and Infrastructure Setup (Oct 20–23): imported the trained model and created a working Flask app; then added Terraform definitions for S3 hosting and Lambda infrastructure.
Integration and API Development (Oct 24–27): packaged the model directly into the Lambda Docker image, integrated API Gateway, and connected the React front end.
UX Refinement and Production Readiness (Oct 28–31): refined responsiveness, added address lookup and date-time controls, handled CORS correctly, and improved accessibility. The last commits focused on cleaning up documentation and aligning the Terraform process with production deployment.
Deployment Workflow
A single prod.tfvars file defines the AWS region, domain, certificate ARN, and tokens.
Running:
cd infra/pipeline
terraform init -upgrade
terraform apply -var-file=prod.tfvars
provisions the infrastructure, while:
make deploy
builds the React site, syncs it to S3, and invalidates CloudFront.
Lessons and Takeaways
Integrating an ML model into a live geospatial app required bridging two worlds: the precision of data science and the responsiveness expected in front-end design.
A few lessons stood out:
Preflight CORS handling in Lambda is non-negotiable for browser clients.
Packaging the model inside the Lambda image avoids S3 access complexity and cold-start delays.
Terraform keeps deployments reproducible; one configuration now builds the full stack in under ten minutes.
What’s Next
Future versions will compare multiple alternate routes, integrate traffic data, and eventually retrain the model on richer features such as real-time visibility and road-surface conditions.
For now, Road Risk Playground demonstrates how a Kaggle notebook can evolve into a deployed, interactive system—bridging data, mapping, and cloud engineering in one application.