This month’s Kaggle Playground Prediction competition is Predicting Road Accident Risk. This competition includes a second part to create a web application that uses the model to add some interactive elements to help explore the data. The Roadrunner application that I wrote about earlier already has code that allow selecting origina and destination addresses. I could adapt that code, add a time of day chooser, and have all I needed to allow user’s to select ad-hoc routes in the real world! One of the most challenging inputs to quantify, however, was a road’s “curviness”. How do you translate a winding road into a numerical score?
This post details my approach to solving this problem using the Mapbox Directions API and some geometric calculations in Python. My goal is to eventually build a tool where a user can select a route on a map and get a risk assessment at the current time, or any other date and time. A Jupyter notebook containing the code and documentation is available on Github.
The Strategy: From API to Polyline
I’ve used Mapbox in many past projects, and their APIs are both powerful and data-rich. Beyond just displaying maps, their Directions API is perfect for this task. When you provide an origin and destination, the API returns a detailed JSON response with turn-by-turn directions. Crucially, this response includes a GeoJSON polyline that describes the exact geographic path of the route. This polyline is the key; we can use it to calculate curviness.
If you want to follow along, you’ll need a Mapbox account and an access token. Their free tier is quite generous; I’ve never hit the limit despite frequent use during development.
Gathering Test Routes
To validate the method, I needed a few sample routes with different characteristics:
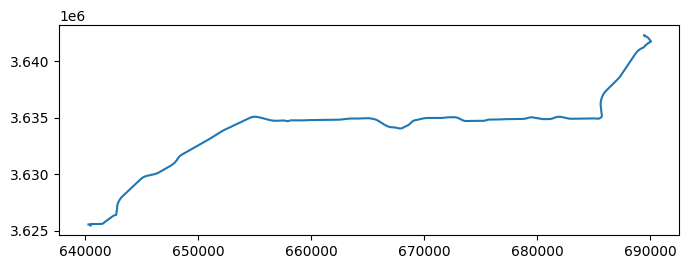
Mostly Straight: A drive from west Fort Worth to the DFW airport in Texas.
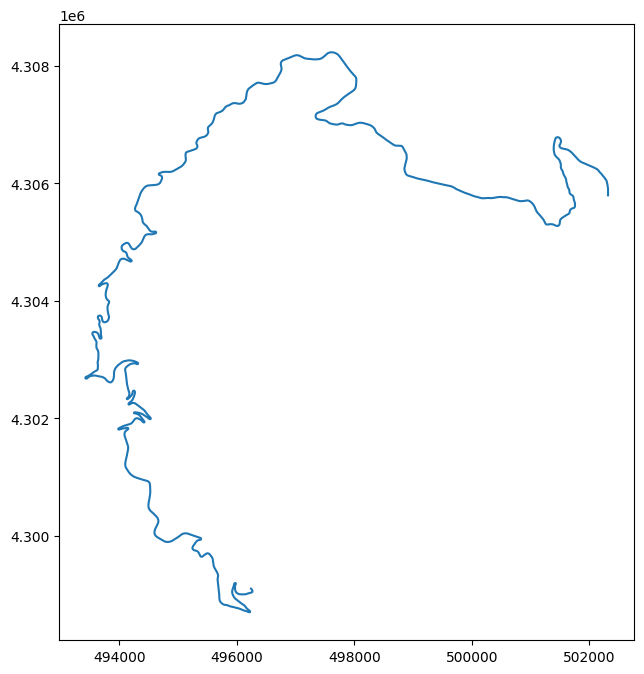
Very Curvy: The famous, twisty Pikes Peak Highway in Colorado. You can see for yourself on YouTube as a driver breaks the time record.
First, I defined a function to call the Mapbox API and retrieve the route geometry. An important step here is to convert the coordinates into the appropriate Universal Transverse Mercator (UTM) Coordinate Reference System (CRS). UTM is essential because it provides coordinates in meters and avoids the distortion that can occur at different latitudes, ensuring our angle calculations are accurate.
The function extracts the GeoJSON geometry from the API response and loads it into a GeoDataFrame, converting it to the local UTM CRS.
Below are plots of the geometries:
DFW Route
Pikes Peak Route
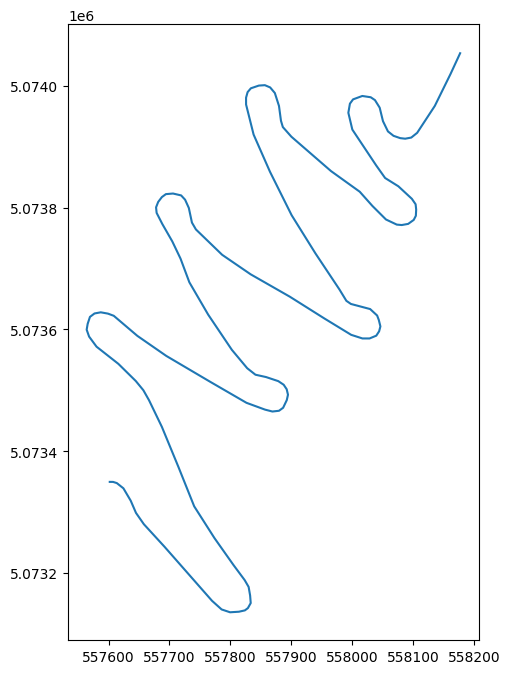
Idaho Route
2. The Curviness Logic
The core idea is to measure the angle formed by any three consecutive points along the route’s path.
A perfectly straight path would result in an angle of 180°.
A sharp turn would result in a much smaller angle.
I created a function, calculate_linestring_curvature, that iterates through every vertex in the route’s polyline and calculates the angle formed by it and its immediate neighbors (the point before and the point after). This produces a list of angles, one for nearly every point along the path.
3. From Angles to a Single Score
A long list of angles isn’t a practical feature. To create a single, representative score, I calculated the statistical mean of all the angles for a given route.
Looking at the results, a clear pattern emerged:
DFW Route Mean Angle: 176.88°
Pikes Peak Mean Angle: 169.54°
Idaho Route Mean Angle: 164.46°
This confirms that the mean angle is a great proxy for curviness, with 180° representing a perfectly straight road.
To normalize this into a simple 0.0 to 1.0 scale, I set 180° as the “zero curve” score (0.0) and decided that a mean angle of 160° or lower would represent a “maximally curvy” score (1.0). This scaling allows for a clear and understandable final output.
Final Results
Running the three test routes through the final function yielded exactly the results I’d hoped for:
DFW route curviness: 0.156
Pike’s Peak route curviness: 0.523
Idaho route curviness: 0.777
The scores clearly reflect the nature of each road, providing a reliable, quantitative feature for the prediction model. I hope this look into a real-world application is helpful.